The Financial Crisis Will Be
Greater Than The
Pandemic Crisis
QQQ Is Completely Exhausted And Overvalued
Summary
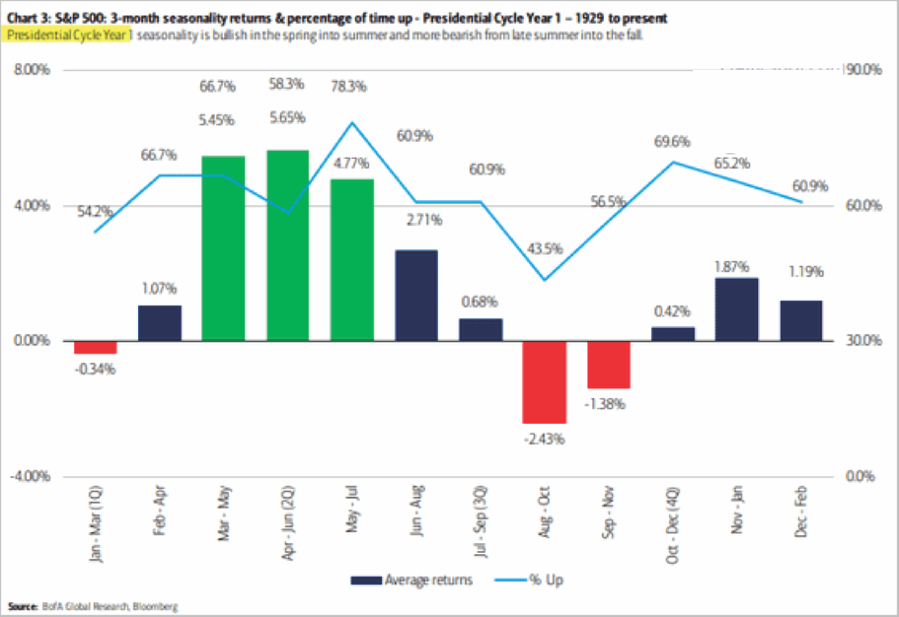
- Beware the seasonally weak late summer to autumn period for U.S. stocks.
- Upside participation on Wall Street is increasingly focused on a handful of mega-cap technology stocks, a huge warning historically.
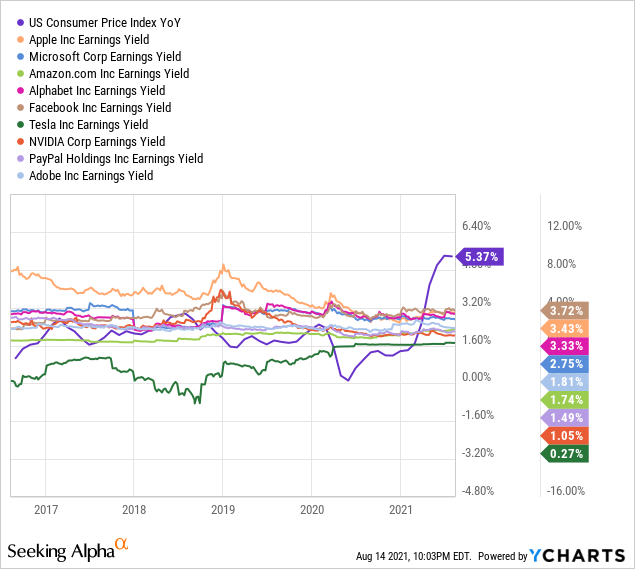
- Buying technology names generating earnings yields half the rate of CPI inflation is borderline madness, for the math impaired.
- Record U.S. equity overvaluations and stock ownership, concentrated in Big Tech names, is the recipe for a bear market.
The Big Tech sector of the market has been rising like a hot air balloon since last March, approaching 18 months of relentless advance. The year and a half total return of +120% is a modern record rise, over such a short period of time, for the NASDAQ 100 index of the largest technology businesses in America. Despite the fact President Biden and the Democrats controlling Congress have promised higher taxes and new regulations on Big Tech, the main index of the sector’s performance has gained a net +38% over nine months (since election night).
Yet the underlying technical picture has reached a position beyond a normal exhaustion zone for both the hypothetical index and its main ETF tracking tool, the Invesco NASDAQ 100 (QQQ). My worry, fully backed by decades of trading experience and a little bit of basic common sense, is any speed bump of unexpected bad news could ignite serious selling and a vacuum of buyers. The downside drop could happen without further warning, as breadth numbers have turned horrible in July-August 2021.
Don’t tell the average investor Big Tech stocks may fall soon. Last week saw $1.9 billion in new capital flow into the leading NASDAQ 100 passive investment product. It witnessed the biggest inflow of any ETF in early August.
Stocks like Apple (AAPL), Microsoft (MSFT), Amazon (AMZN), Alphabet-Google (GOOG) (GOOGL), Facebook (FB), Tesla (TSLA),NVIDIA (NVDA), PayPal (PYPL), and Adobe (ADBE) have been responsible for about one-third of all U.S. equity market gains the last five years, especially after the pandemic appeared. This group represents the 10 largest weightings in the capitalization design of the index, and nearly 53% of total QQQ value.
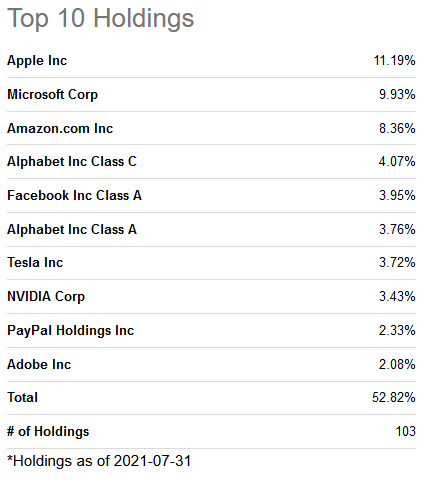
As I have been mentioning in articles for months on Seeking Alpha, owning Big Tech stocks with earnings yields less than half the prevailing CPI inflation rate is borderline madness for rational long-term investors. Why would you want to buy/hold a guaranteed yield failing to keep pace with basic cost-of-living increases? Against the year ago situation of earnings yields double or more the inflation rate, stocks have quickly moved from incredibly undervalued to a seriously overvalued setting.
Seasonal Considerations
Will fading breadth usher in a sharp 10%+ QQQ correction between late August and October, typically the weakest seasonal period for Wall Street pricing? The worst part of the calendar year to own U.S. stocks historically is between mid-July and early October over the last 30 years.
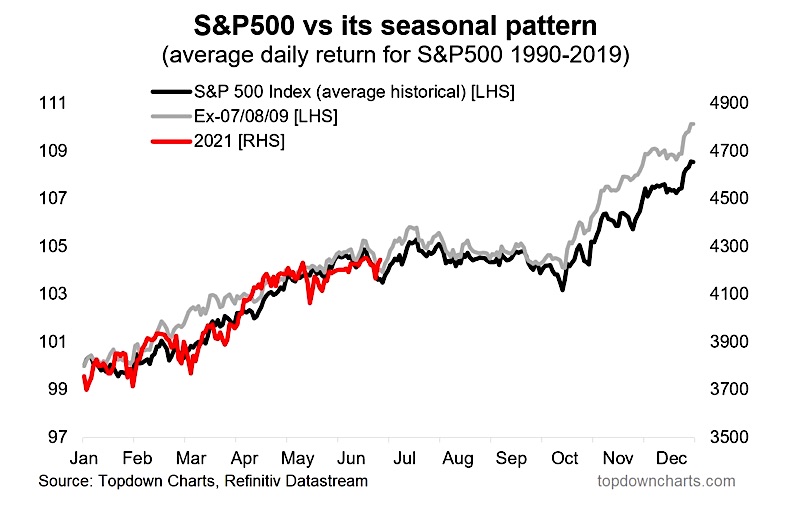
Image Source: See It Market Website
For QQQ specifically, over the last 20 years, less of a seasonal sell-off trend between late summer and early fall has been part of the equation. My thinking is this picture actually adds to the chance of a serious decline upcoming in 2021. To reach more normal patterns on the calendar vs. the overall market an outlier downside event to move QQQ into a “reversion to the mean” may be next.
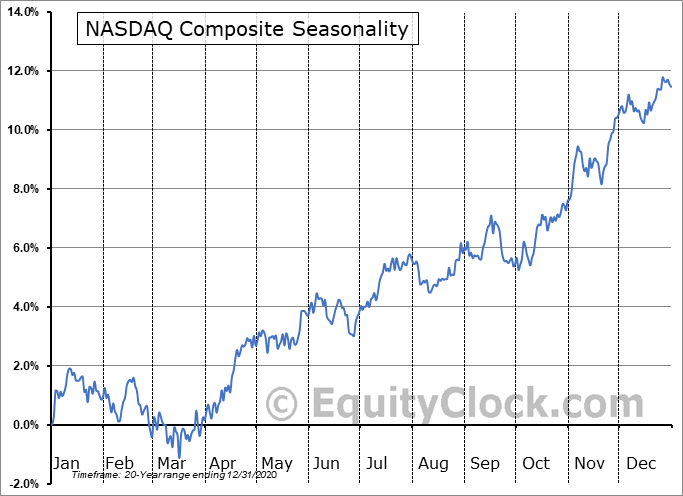
Image Source: Equity Clock Website
Undergoing two rough 10% price corrections in September 2020 and February-March 2021, the question I am asking daily is when will a more substantial decline greater than 10% occur again? I count 13 corrections of greater than 15% since QQQ’s inception in 1998, which averages out to every 1.75 years. 20% declines have taken place nine times, about once every 2.5 years. From a purely statistical sense, we may be “due” for a 15% decline soon, with a regular 20% bear market increasingly probable the next 12 months.
Weakening Breadth Numbers
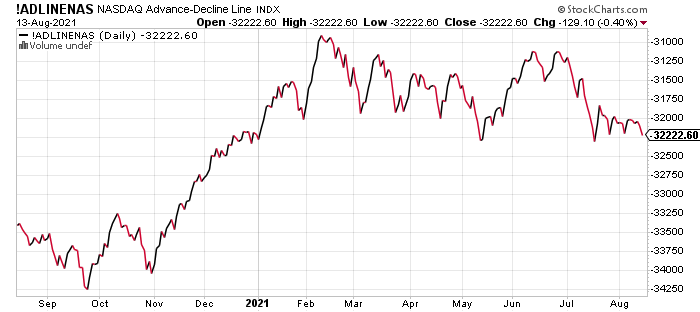
The advance/decline numbers of issues on the whole NASDAQ marketplace have turned decidedly negative in July-August. Below is a 1-year record of the difference between advancing and declining issues for price at the close each session. Notice the peak for breadth came all the way back in February. Typically, a rising line highlights strong individual name participation in a bull move. Flat to sliding A/D lines signal weakening buy trends with fewer and fewer stocks participating.
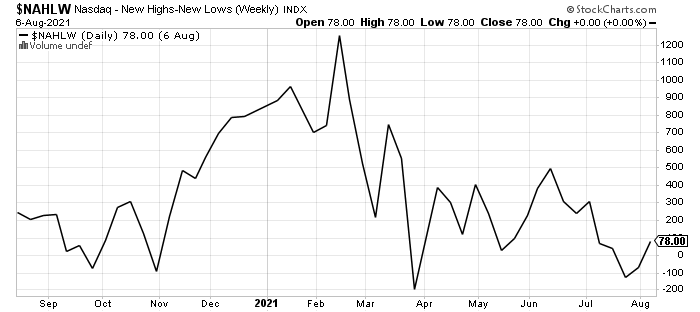
Weakening participation is also indicated when new 52-week high prices are failing to beat the number of lows. On the 1-year graph below, you can see new highs and lows are about the same each week, over trading the last month. Despite all-time highs in the main U.S. equity market averages, including QQQ in July-August, fading breadth participation is a hallmark signal of trouble in past topping scenarios. Without doubt, the rotten performance this summer in advances/declines and highs/lows is a problematic development for those hoping stocks will never again experience a sharp drawdown in price.
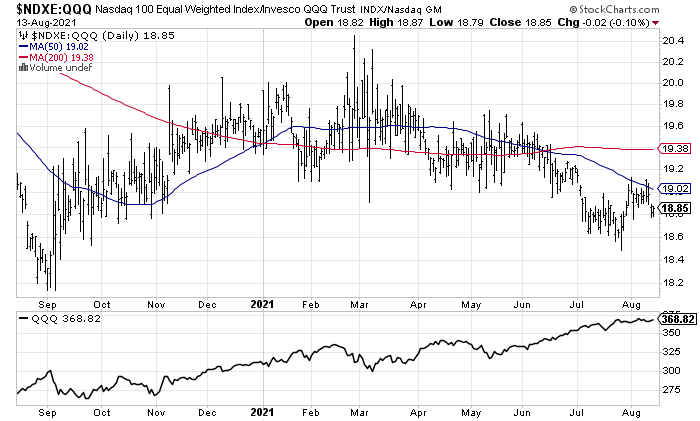
Lastly, when a bull market is strong and upside momentum is building, individual stocks of all types and sizes are rising in price. You can compare an “unweighted” QQQ creation, where all names in the NASDAQ 100 index start each trading day equal in importance. When this indicator is rising faster than the normally weighted index, a bullish condition is present. Conversely, when all the gains are concentrated in the largest 10 or 20 positions, the unweighted index will fail to keep up with advances in the regular calculation. Below is a 1-year graph of daily changes in the two constructs played against each other. You can review how strong gains were present until February. Since then, gains in Big Tech have been increasingly and bearishly concentrated in a handful of companies. A huge downshift in breadth has occurred since June.
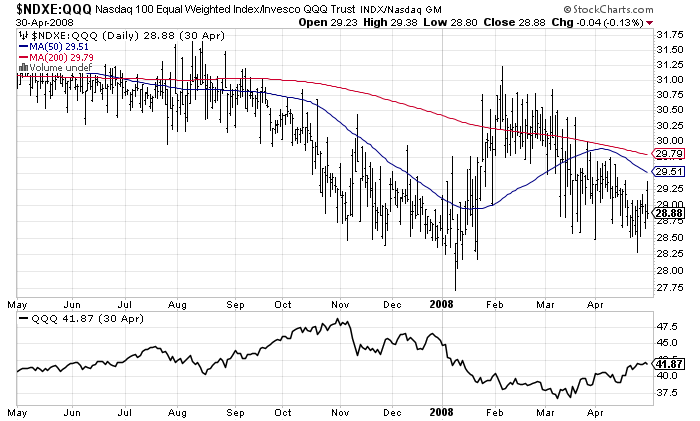
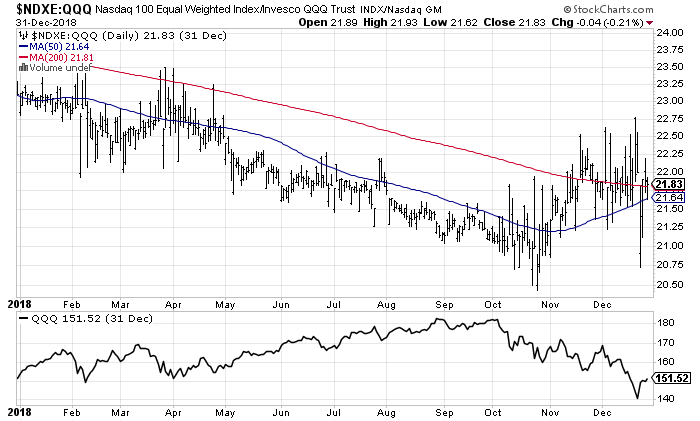
Past bear market peaks have often experienced a steady relative decline in the unweighted index vs. QQQ for 3-6 months before prices turned down sharply. Below are charts of the 2007 top going into a 50%+ bear market (and Great Recession real estate bust), plus the 20% downturn in late 2018. They are great examples of the usefulness of watching the participation by all equities in the QQQ product.
Final Thoughts
Does weak breadth guarantee a large price drop is next? Not exactly. Using the indicator toolbox listed in this article, there have been occasions where flat to subpar QQQ gains have occurred the following 6-12 months. Nevertheless, if our future is a flat to lower stock market, now is the time for caution and raised cash levels. Preparing for a 15% correction or even a 20%+ bear phase is prudent in August, and has been a sound idea for months.
Eventually, a surprise war or terrorist attack will happen again. Perhaps a monster hurricane or climate change event is brewing. Maybe the delta variant will slow the economy more than expected into Christmastime, with even bigger government budget deficits and a jump in unemployment trends appearing. Already, consumer confidence is imploding as Americans realize the summertime was just a break for COVID-19, not the end of the pandemic. The University of Michigan’s consumer sentiment index tumbled to 70.2 in early August, its lowest reading since 2011. Maybe the dollar’s value will have issues with stubbornly high inflation rates, forcing interest rates to rise during a slowing economic backdrop.
With record overvaluations on trailing business sales or GDP output in 2021, and investors more exposed to equities (fully invested) than any other time in modern history, the “risk” side of the investment equation is screaming for reduced stockholdings.
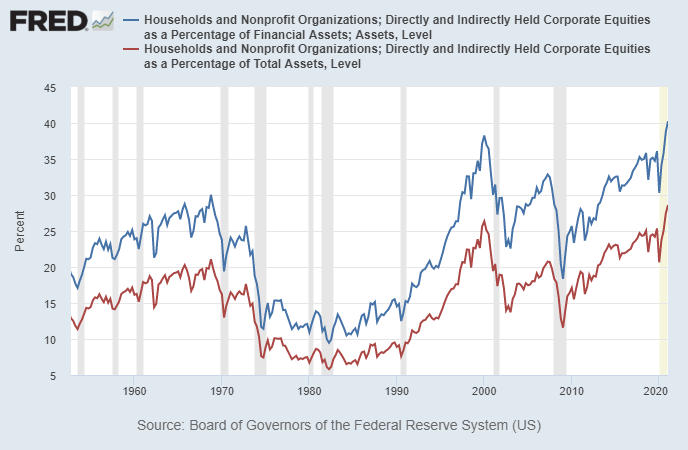
Image Source: St. Louis Fed
Looking at the whole risk-reward investment landscape, taking profits now, while avoiding jumping into stocks with any savings you have on the sidelines is completely logical. I have been warning for months a 10-15% market drawdown will wipe out most of this year’s gains. And, if some sort of unforeseen event generates a sharp overnight drop, you will not have a chance to get out of the way. Seasonal trends and weak breadth are screaming to avoid the Invesco NASDAQ 100 ETF, until we get to October-November. You may get lucky and sidestep a major bear market. I rate QQQ a Sell currently, especially for contrarian thinkers. I am using shorts in Big Tech names as hedges against more sensible valuation picks in my portfolio.
When Is The Next Bear Market? 3 Things Will Tell You
Summary
- Since bonds are loans to borrowers, a bond’s interest rate is tied to the prevailing rate environment at the time of issuance.
- Historically speaking, from the time yield curves begin to invert, the span to the next recession runs roughly 9-months. However, note that yield curves are currently declining, suggesting economic growth will weaken.
- The risk of a market correction rises further when the Fed is tapering its balance sheet and increasing the overnight lending rate.
- The Fed should use the $120 billion in monthly QE to hike rates and prepare for the next recession. But, instead, they continue to kick the “policy can” further down the road.

The question I get most often is, “when is the next bear market?” Three specific items tend to predict bear markets and recessions with some accuracy.
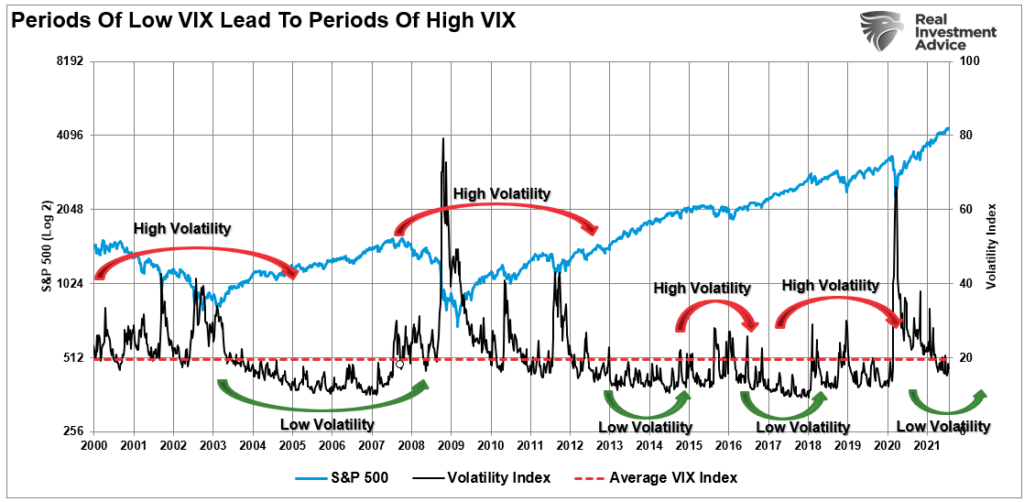
However, before we get to those points, a “bear market” requires excesses that need reversion. In other words, a mean-reverting event needs “fuel.” Several measures suggest excesses are sufficient to fuel a meaningful reversal.
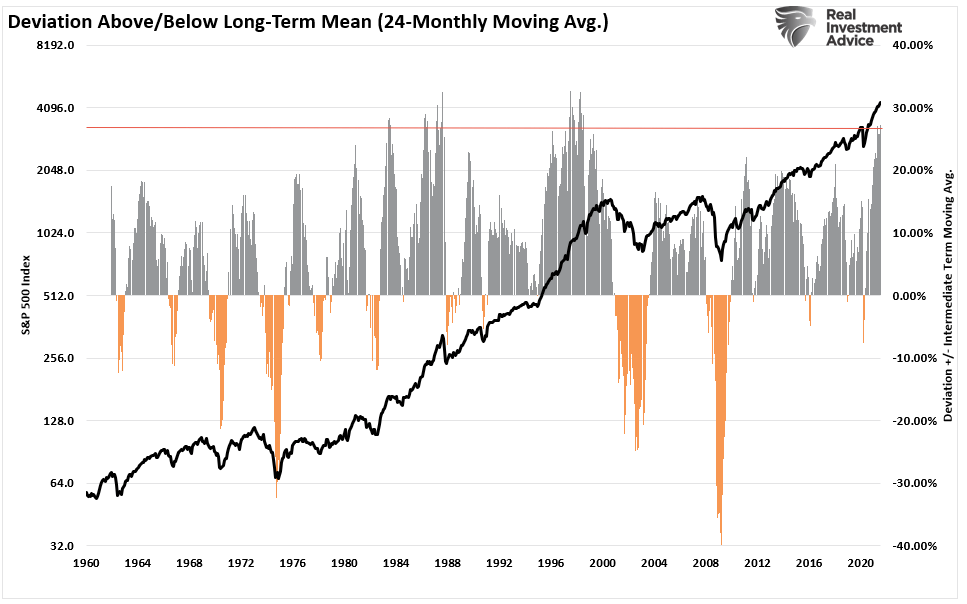
Deviation From Long-Term Means
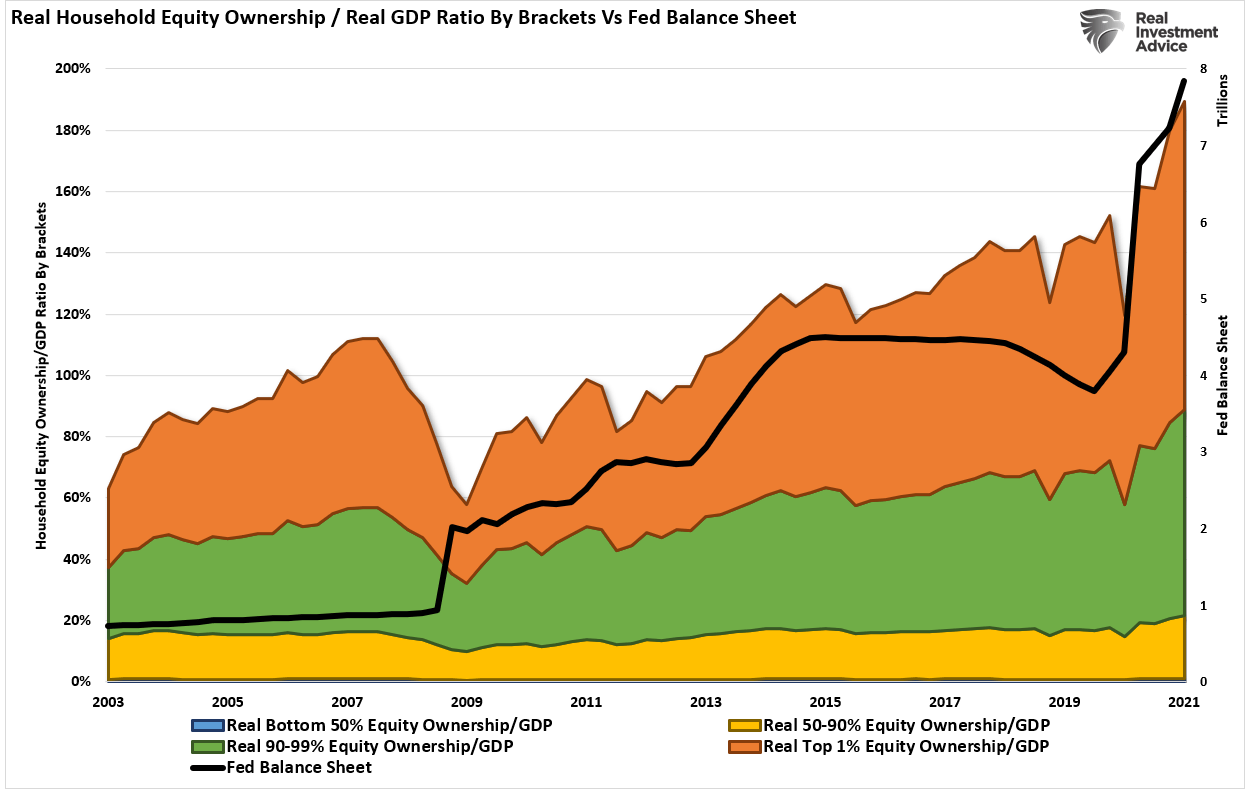
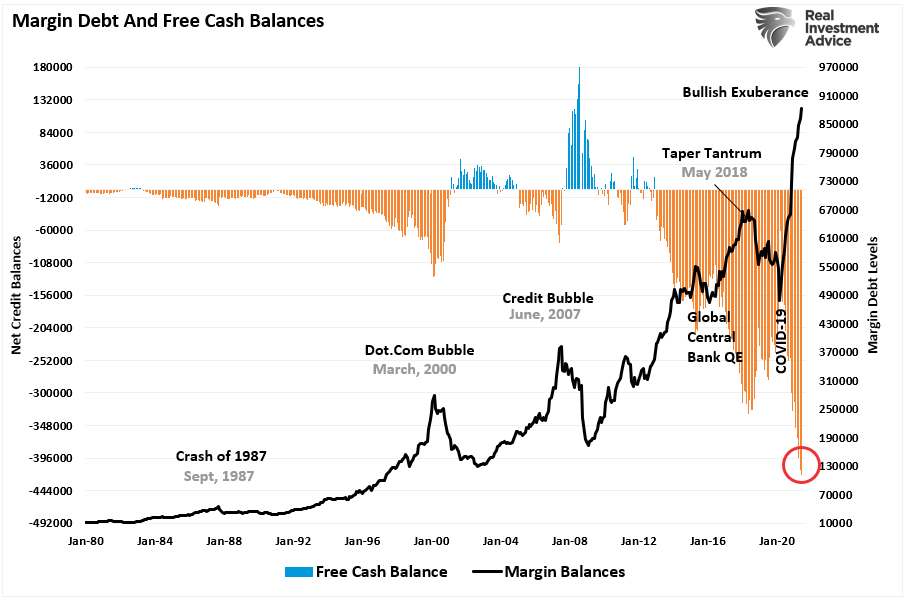
Household Equity Ownership
Margin Debt
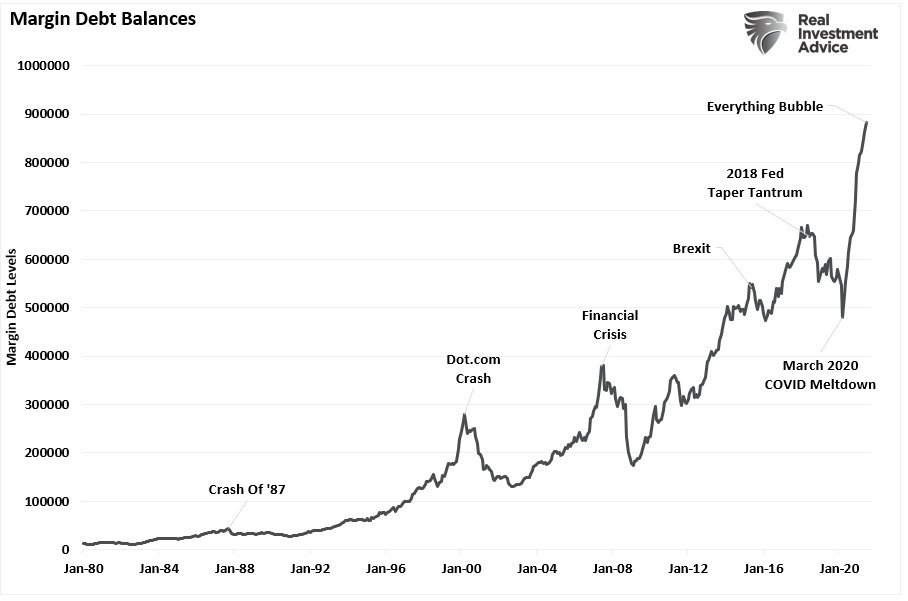
Importantly, none of these measures mean a “bear market” is imminent. Instead, it requires a catalyst to cause a change in sentiment from “greed”to “fear.” As noted, three indicators historically denote when the “clock starts ticking” to the next bear market.
Yield Curve
The yield curve is one of the most important indicators for determining when a recession, and a subsequent bear market, approaches. The chart below shows the percentage of yield curves that invert out of 10-possible combinations.
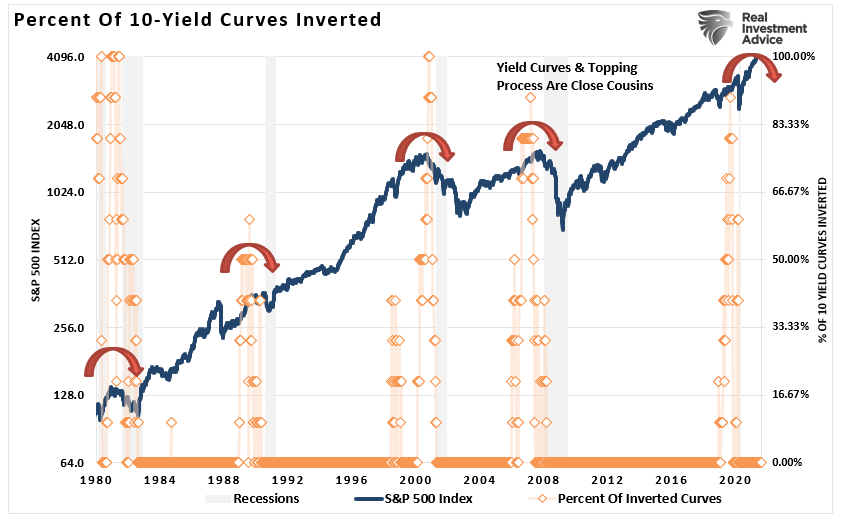
Investors should never dismiss the message sent by the bond market. Bonds are essential for their predictive qualities, which is why analysts pay an enormous amount of attention to U.S. government bonds, specifically to the difference in their interest rates. Why is this?
Unlike stocks, there is a finite value to bonds. At maturity, the lender receives the principal along with the final interest payment. Therefore, bond buyers are aware of the price they pay today for their return tomorrow. Unlike an equity buyer taking on “investment risk,” a bond buyer is “loaning” money to another entity for a specific period. Therefore, the “interest rate” takes into account several “risks:”
- Default risk
- Rate risk
- Inflation risk
- Opportunity risk
- Economic growth risk
Since the future return of any bond, on the date of purchase, is calculable to the 1/100th of a cent, a bond buyer will not pay a price that yields a negative return in the future. (This assumes a holding period until maturity. One might purchase a negative yield on a trading basis if expectations are benchmark rates will decline further.)
Therefore, since bonds are loans to borrowers, a bond’s interest rate is tied to the prevailing rate environment at the time of issuance.
Therefore, there is a high correlation between rates, the economy, and asset prices over the long term. Oil prices, trade tensions, political uncertainty, the dollar, credit risk, earnings, etc., are reflected in the interest rate for different durations of loans.
Which Yield Curve Matters
Which yield curve matters mostly depends on whom you ask.
DoubleLine Capital’s Jeffrey Gundlach watches the 2-year vs. 5-year spreads. Michael Darda, the chief economist at MKM Partners, says it’s the 10-year and the 1-year spread. Others say the 3-month and 10-year yields matter most. The most-watched is the 10-year versus the 2-year spread.
So which is it? As discussed in “Which Yield Curve Matters:”
“The best signals of a recessionary onset have occurred when a bulk of the yield spreads have gone negative simultaneously. However, even then, it was several months before the economy actually slipped into recession.”
Following the “Dot.com” crash, the entire tragic event was considered an anomaly, a once-in-a-100-year event that would not replicate again. Unfortunately, just 4-years later, in 2006, investors again were told to ignore the yield curve inversion as it was a “Goldilocks economy” and “sub-prime mortgages were contained.”
Advice to ignore yield curve inversions has not worked out well for investors.
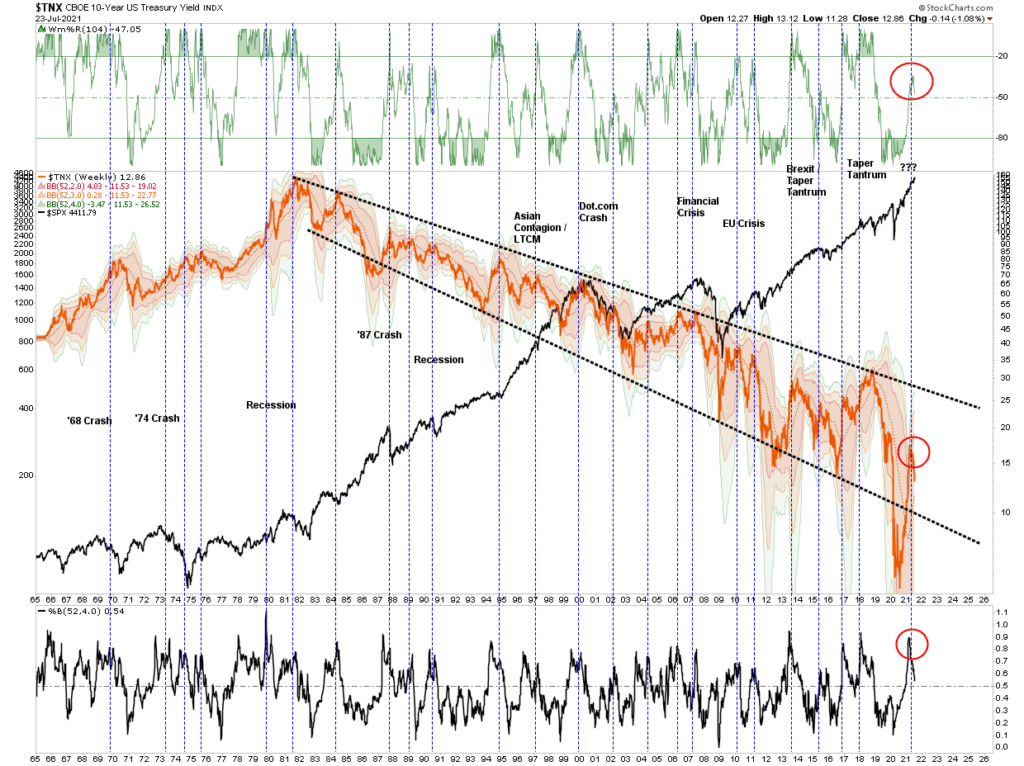
The quad-panel chart below shows the 4-previous periods where 50% of 10-different yield curves became inverted. I have drawn a horizontal red dashed line where 50% of the 10-yield curves we track are inverted. I have also denoted the optimal point to reduce risk relative to the subsequent low.
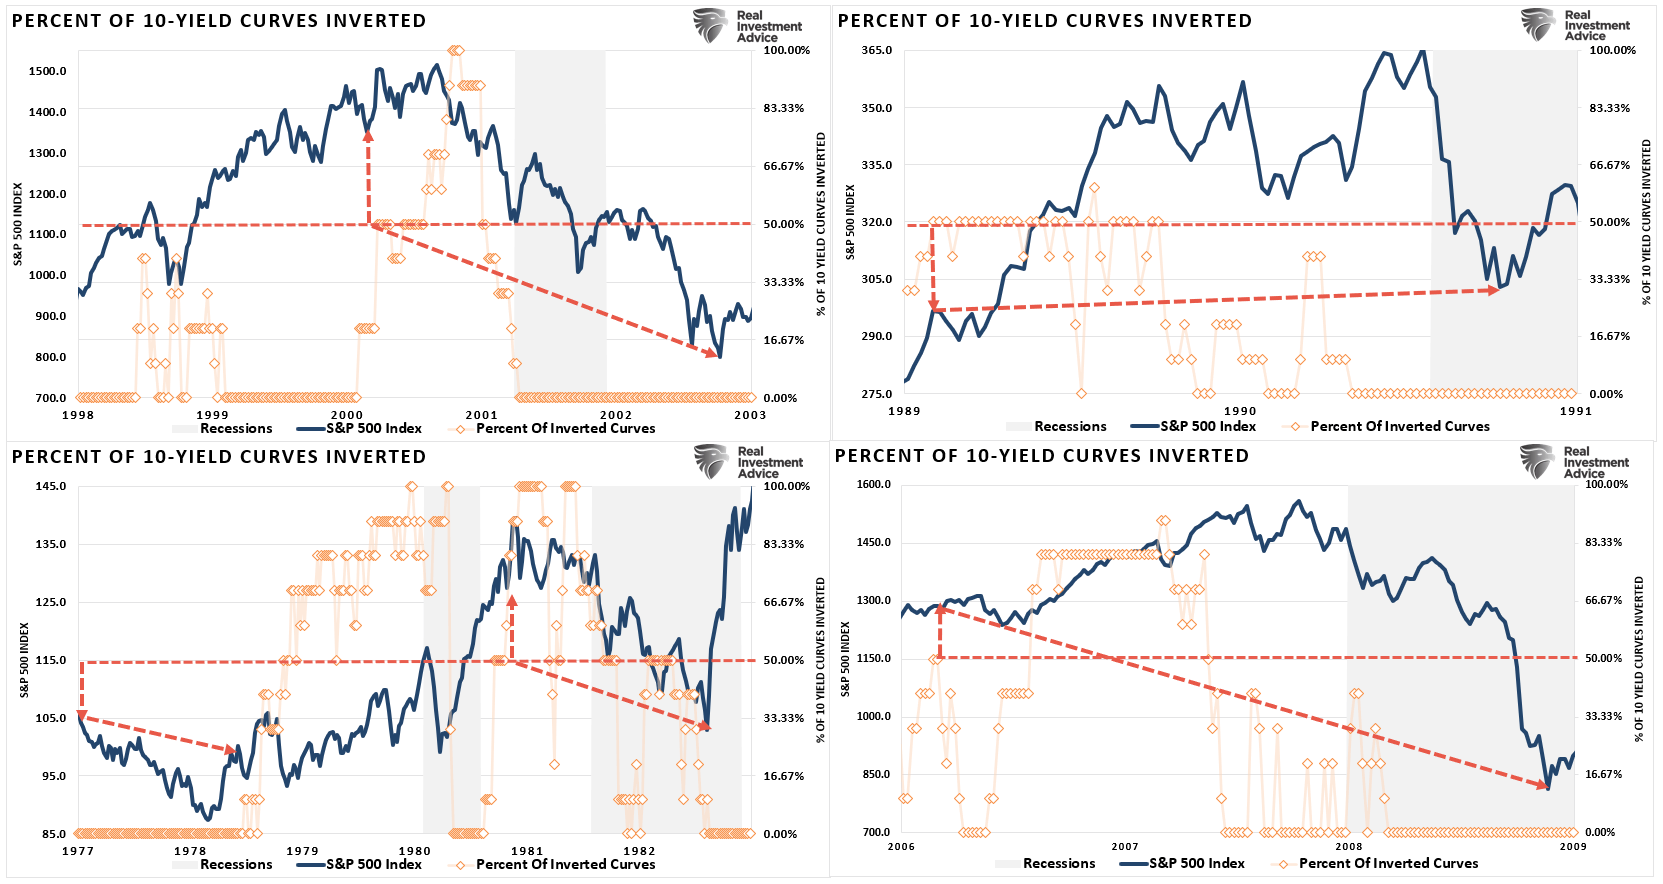
In every case, the market did rally a bit after the initial reversion before the eventual reversal.
No Inversion Yet
The chart below is the percentage of the 10-yield spreads that are currently inverted. At the moment, that number is at zero suggesting there is no risk of a recession or “bear market.” However, as you will note, when inversions occur, they tend to happen quickly.
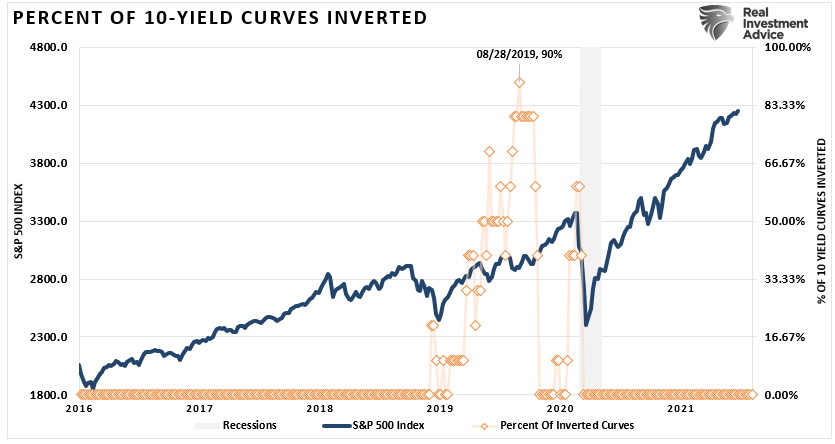
Historically speaking, from the time yield curves begin to invert, the span to the next recession runs roughly 9-months. However, note that yield curves are currently declining, suggesting economic growth will weaken. If this trend continues, another “inversion” would not be a surprise.
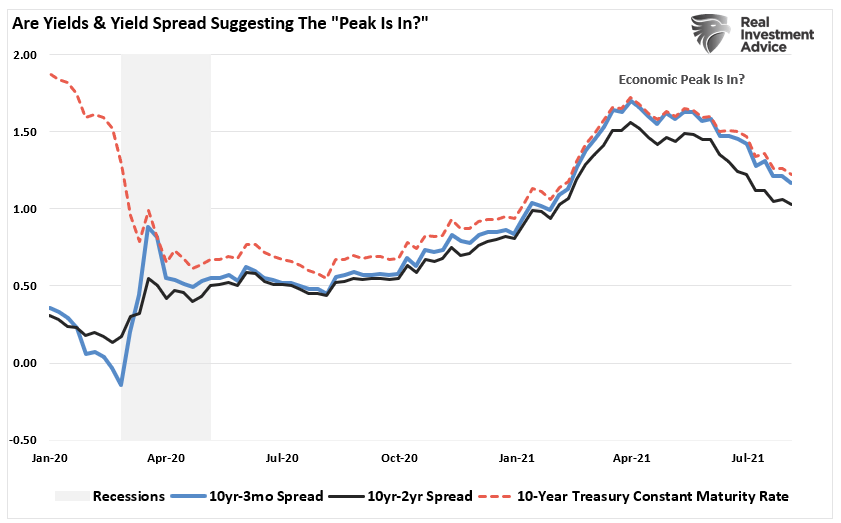
Given the strong track record of predicting recessions historically, when the subsequent inversion occurs, the media will quickly dismiss it as they did in 2019.
They will likely be wrong again.
Fed Taper
Recently, the Federal Reserve stated they are “thinking about thinking about tapering” its bond purchases. However, the issue of “tapering” is not as much about the Fed’s actual reduction of bond purchases as it is about psychology.
“The key to navigating Quantitative Easing! and Fed policy in general is to recognize that their effect on the stock market relies almost entirely on speculative investor psychology. See, as long as investors get inclined to speculate, they treat zero-interest money as an inferior asset, and they will chase any asset with a yield above zero (or a past record of positive returns). Valuation doesn’t matter because investor psychologically rules out the possibility of price declines in the first place.” – John Hussman
In other words, “QE” is a mental formation. Thus, the only thing that alters the effectiveness of the Fed’s monetary policy is investor psychology itself.
Such was a point made in the “Stability/Instability Paradox.”
“With the entirety of the financial ecosystem now more heavily levered than ever, due to the Fed’s profligate measures of suppressing interest rates and flooding the system with excessive levels of liquidity, the ‘instability of stability’ is now the most significant risk.”
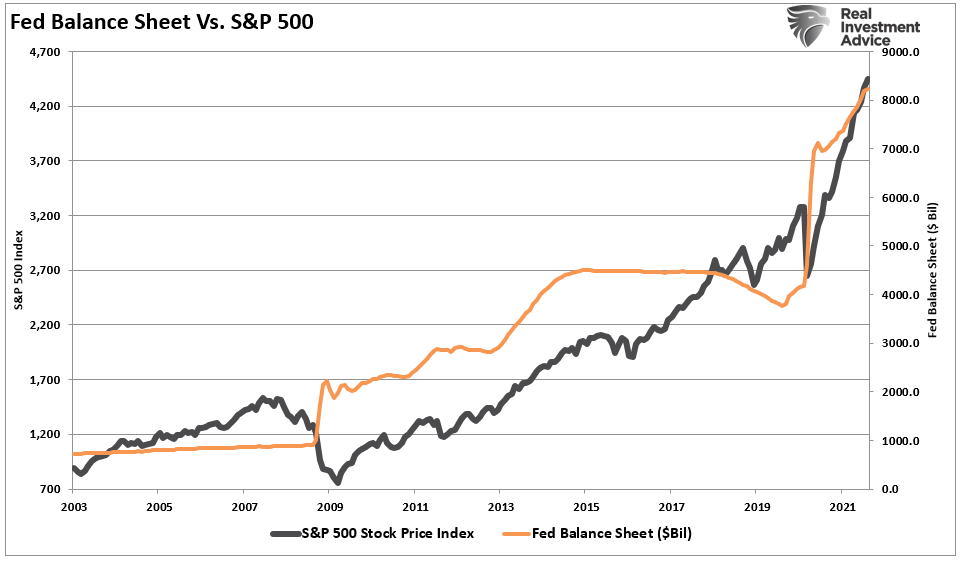
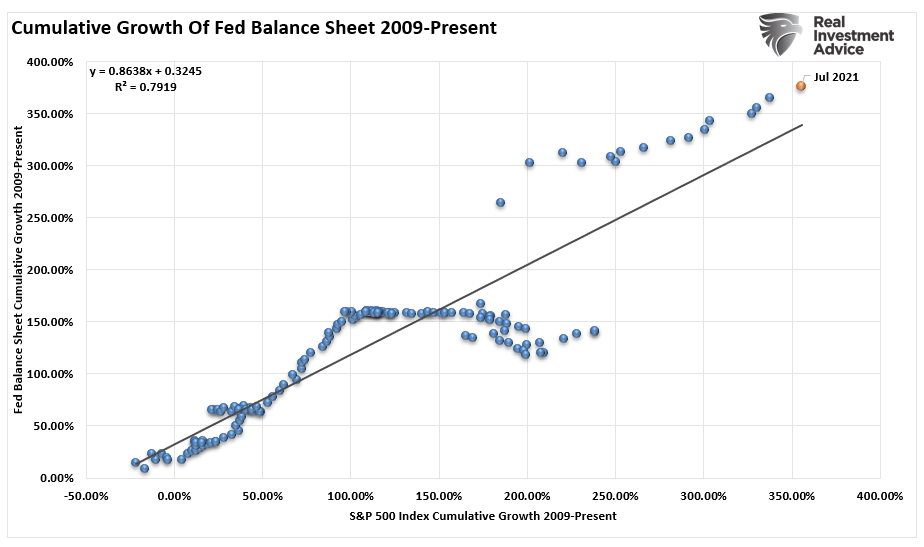
There is a correlation between expanding the Fed’s balance sheet and the S&P 500 index. Whether the correlation is due to liquidity moving into assets through leverage or just the “psychology” of the “Fed Put,” the result is the same.
Therefore, it is no surprise that market volatility increases when the Fed starts “tapering” their bond purchases. The grey shaded bars show when the balance sheet is either flat or contracting.
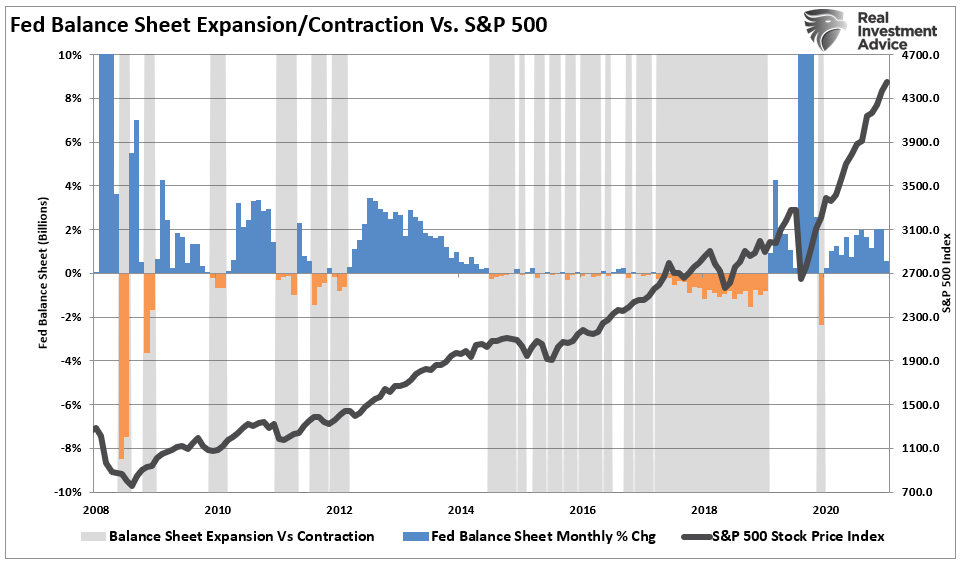
Notably, the time from the initial tapering of assets and a market correction is almost immediate.
However, taper leads to rate hikes.
Fed Rate Hikes
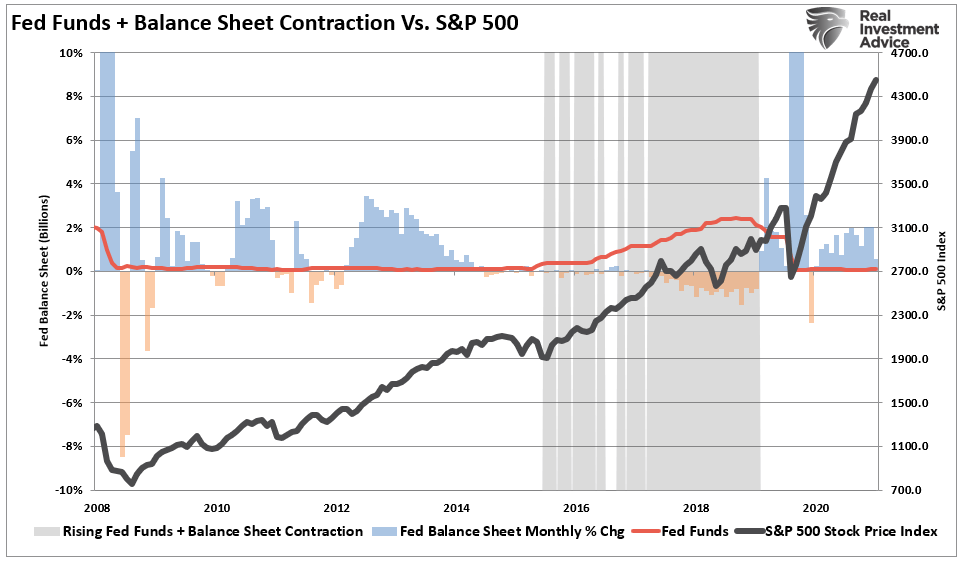
The risk of a market correction rises further when the Fed is tapering its balance sheet and increasing the overnight lending rate.
What we now know, after more than a decade of experience, is when the Fed slows or drains its monetary liquidity, the clock starts ticking to the next corrective cycle.
As discussed previously, the Fed should use the $120 billion in monthly QE to hike rates and prepare for the next recession. But, instead, they continue to kick the “policy can” further down the road. The longer they wait, the harder it will be to normalize policy without risking significant market volatility and reversing the economic recovery.
Of course, history already shows such will happen. Once the Fed begins to hike rates, market corrections occur quickly, generally within 2-4 quarters. However, recessions and bear markets take longer and get extended due to ongoing interventions. The current median time frame between the first rate hike and the onset of a recession is 11-quarters. (The shaded green bars denote rate hike campaigns.)
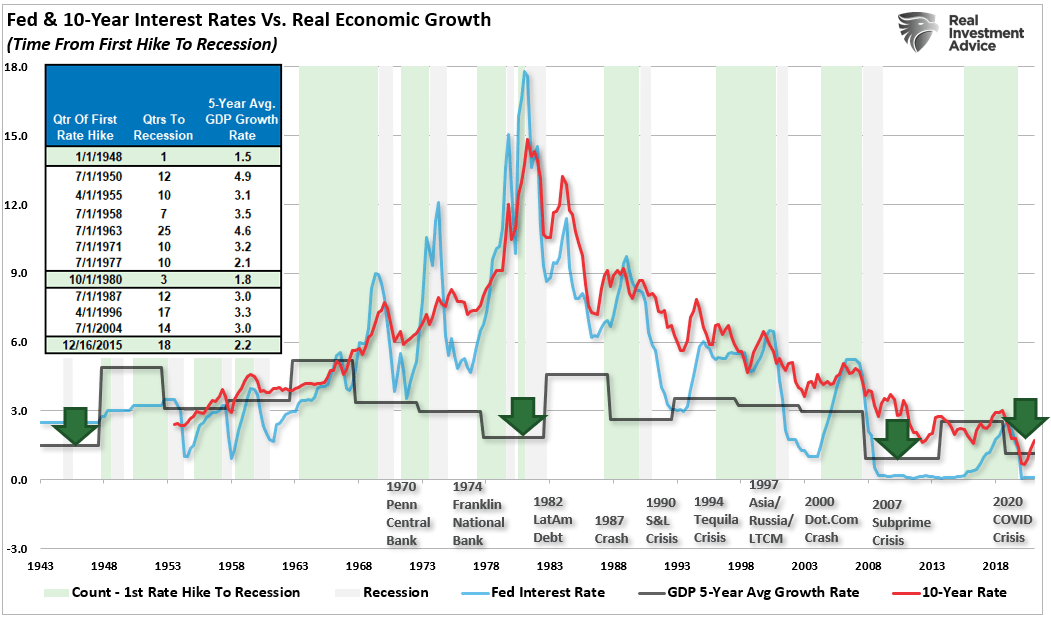
Notably, there are ZERO times in history where the Fed hikes rates that did not end negatively.
Conclusion
There is currently no indication of a recession. Nevertheless, the Fed continues to purchase $120 billion a month in bonds keeping the “psychological Fed put” in place.
The Fed is also keeping the overnight lending rate at zero, and the yield curve is nowhere close to inverting just yet.
However, these items will change quickly, and when they do, the clock will start ticking towards the next recession and bear market.
As noted in Slowly At First:
“Understanding that change is occurring is what is essential. But, unfortunately, the reason investors ‘get trapped’ in bear markets is that when they realize what is happening, it is far too late to do anything about it.
Bull markets lure investors into believing ‘this time is different.’ When the topping process begins, that slow, arduous affair gets met with continued reasons why the ‘bull market will continue.’ The problem comes when it eventually doesn’t. As noted, ‘bear markets” are swift and brutal attacks on investor capital.’”
Pay attention to these indicators. The Fed is discussing taper. The yield curve is flattening, and there is a risk the Fed will hike rates next year. These are all actions very reminiscent of previous market topping processes.
However, tops are hard to identify during the process as “change happens slowly.”
Sentiment Speaks: Can The Bears Muster More Than A Growl?
Summary
- With the market pulling back a bit, many are expecting some big downside follow through.
- The market now has a downside set up.
- I have outlined the parameters for this downside set up.
- This idea was discussed in more depth with members of my private investing community, The Market Pinball Wizard. Learn More »

All we have heard this entire year is that the market is about to come down because of inflation, coronavirus, valuations, economic conditions, or in insert whatever reason you want to place into this sentence. Yet, the market has now rallied 19% in 2021, almost reaching our expectation of a 20% minimum rally in 2021.
So, early this past week, I wrote the following to the members of The Market Pinball Wizard:
“With Covid still spreading, with the issues in China and the Middle East growing worse, with the potential that the Fed is about to taper, and with the first murder hornets being sighted in the United States, I think it is time to look down in the market.”
And, for those that have read me before, you know that I was being facetious. None of these factors really control or direct the market. In fact, when the pundits write about some factor causing the market to do one thing or another, I always wonder if they polled all the market participants in order to come up with their assessment.
I hope you are starting to see how foolish this sounds.
Moreover, one does not even need to know the news in order to trade or invest in the market successfully. And, our 7500+ members and 1000 money manager clients can testify to this fact. In fact, this is what one of our members said about our work this past week, even though we do not follow any news:
“Avi catching the market turn by turn, it was like having a calming navigation guiding me.”
Let’s explore this a bit more, and see if I understand this correctly. The market declined this past week supposedly because of fear of a Fed taper. So, if we continue lower over the coming weeks until the Fed announces a taper, does that mean that the taper will be “priced in” by the time we get to the meeting?
Yes, I know these are mind-bending thoughts to have about the market. But, at some point you should realize that it really makes no sense, nor does it make any difference.
For those that do not remember, the last time the Fed tapered was back in early 2016, and everyone was so certain we would see a market crash. Yet, as we were approaching the end of 2015, I was outlining my expectation for a drop from the 2100SPX region towards the 1775/1800SPX region, which would set us up for a market “melt-up” to 2600+. And, I really did not care what the Fed was going to do. So, I am sure you can imagine how well my views were received by the readership when the Fed was about to taper. And, despite the Fed tapering, the market proceeded to rally from the 1800 region in an almost straight line towards 2880SPX. Yes, my friends, we saw a 60% rally despite the Fed tapering.
So, are you scratching your heads yet? Well, if you think the Fed is so powerful, then you should be. Yet, there are some of us who hold no such views of the Fed. In fact, I have fought the Fed many times and have won. I even outlined some of the other times in this article:
Sentiment Speaks: I Fought The Fed… And I Won
So, the question now is whether the market is ready to give us the 200-300 point pullback I expect to see before we are ready to rally through the 4600SPX region. The structure for such a pullback is now in place in an almost textbook fashion. But, to be honest, the setup is almost too perfect. Allow me to explain.
The market broke below initial support last week, and took us to the next support region I outlined to the members of The Market Pinball Wizard. And, before the market opened on Thursday, I outlined to our members my expectation for a rally back up towards the 4440SPX region. As we now know, the market struck a high on Friday around 4445SPX in what seems like a corrective rally.
But, as I said, this action was almost too perfect. So, with us being in a bull market which likely has much higher to go in the next year or two, it is now time to be a bit more cautious on both sides of the trade. It has been a long time since the market provided us with a 200+ point pullback potential, and while we have one on the chart right now, 200+ point pullbacks in the market have been anything but a slam dunk over the last year. So, even though the setup is in place, we need to see confirmation action that we are dropping in that pullback.
Our resistance is the 4450SPX region, support is at 4410-15SPX, and the setup is now in place for the 200-300 point decline I want to see. In order to confirm that we are in the process of that 200-300 point decline, we need to see an impulsive break down below 4410-15SPX, which will make it a high probability we are next targeting the 4240-70SPX region. (Keep in mind that “impulsive” means a 5-wave decline structure and not how fast it moves). If this is not what we see early in the coming week, then the market may try to push to a marginally higher high before turning down again.
This would be an appropriate time to remind all readers that we are in a bull market which likely has much higher to be seen in the coming year or two. As we came into 2021, I was looking for a 20% rally, with our next main target in the 4440SPX region. Since we have hit our initial target, I am now on high alert for a pullback which, thereafter, will set the market up to rally to my next major target in the 4900/5000SPX region, likely taking us into 2022. So, remember, pullbacks are buying opportunities, not necessarily shorting opportunities. And, for those that are nimble enough to attempt to short downside setups, please make sure you understand your risk parameters, especially since a strong move through 4450SPX is a signal that we are not yet ready to follow through in a 200+ point decline just yet. This is a setup, and it has yet to confirm.
Now, I know there will be some foolish comment below claiming that I am saying that the market is either going to go up or down. But, the market is not linear, therefore, we must approach it with a non-linear methodology. So, if anyone takes the time to read my analysis carefully, you will understand that I simply provide to you if/then analysis as to how the market will react, and I provide very specific levels and targets within such analysis. So, if you choose to take a very superficial view of my analysis, I would challenge you to find anyone who offers as specific a guidance as do I.
In the bigger picture, the market is bullish. I am still looking for a rally to the 5500-6000SPX region as we look out over the next two years, especially as long as we respect the major floor in the market between 4100-4165SP. But, I will warn you that as we move into 2022, the long side will not be as easy as we have seen since 2020. There will be much more volatility, but with an upward bias towards our long-term target. Yet, 2022 will likely see the largest pullbacks we have seen since we began this rally in 2020.
Many that have followed me through the years are probably asking how I can make such bold statements about the potential for future price action? Well, it’s based upon the same methodology that told me down in the 2200SPX region that we were about to embark on a rally to at least 4000SPX, with an ideal target in the 6000SPX region.
I know that many are still quite skeptical of our ability to accurately track markets using Fibonacci mathematics, as this person recently noted:
“I’m still skeptical about fibonacci pinball, elliott waves and so forth, but it’s an empirical fact that this man is able to call market tops and bottoms with surprising consistency.”
You see, our methodology simply ranks probabilistic market movements based upon the structure of the market price action, which we calculate based upon Fibonacci mathematics. But, even more importantly than providing us high probability turning points in the market, our analysis methodology tells us quite early on when our initial assessment is wrong. But here is the most important part of the analysis: We also provide you with an alternative perspective at the same time we provide you with our primary expectation, and let you know when to adopt that alternative perspective before it happens.
As I have said many times before, this is no different than if an army general were to draw up his primary battle plans, and, at the same time, also draws up a contingency plan in the event that his initial battle plans do not work in his favor. It is simply the manner in which the general prepares for battle. We prepare for market battle in the same manner.
So, while I will never be able to tell you with certainty how the market will move in the coming weeks, months, and years, I present you with enough information to know where my primary perspective is wrong so that you can adjust in order to take account for the alternative situation. And, until such time that the market proves our primary perspective is wrong, we will continue to follow our primary perspective, which at this time is pointing us to much higher levels in the coming years.
By now, I hope you recognize the difference in our analysis approach, other than the accuracy thereof. We strive to view the market, and utilize our mathematically based methodology, in the most objective fashion as possible, no matter how crazy it may sound. Moreover, it provides us with objective levels for targets and invalidation. So, when we are wrong in the minority of circumstances, we are able to adjust our course rather quickly, rather than fighting the market like many others you may read have been doing during this entire rally off the March 2020 lows.
So, while I hope I am helping many of you in maintaining an objective perspective within this non-linear environment we call the stock market, I want to wish you all well in your future trading and investment endeavors. As of now, I maintain my long-held expectation to see the market in the 6000SPX region in the coming years, of course, unless the market tells us otherwise. But, please approach the market with the respect that a bull market deserves, as surprises usually come to the upside, and we likely have much higher to go before this bull market ends.
British Requests for $3 billion in US Treasury Gold – The Trigger that Closed the Gold Window
Submitted by Ronan Manly, BullionStar.com
I have directed Secretary Connally to suspend temporarily the convertibility of the dollar into gold or other reserve assets, except in amounts and conditions determined to be in the interest of monetary stability and in the best interests of the United States.”
– Richard Nixon, Sunday 15 August 1971Recommended Vide
Exactly 50 years has passed since the US Government famously suspended the convertibility of US dollars into gold on 15 August 1971 in a speech announced by then US president Richard Nixon.
This convertibility of US dollars into gold applied to US dollars held by foreign governments and foreign central banks, which based on the rules of the Bretton Woods monetary system, allowed them to legally show up anytime at the ‘gold window’ of the US Treasury and exchange their excess US dollars for physical US Treasury gold.
There will be much written this month about the 50th anniversary of the closure of the US gold window, but less so about what exactly triggered it and why the timing had to be 15 August.
So without further ado, here is why, and it all revolves around the British ambassador to the US. the 3rd Earl of Cromer, a.k.a. George Rowland Baring, showing up at the US Treasury offices in Washington D.C. on 12 August 1971 and demanding that US dollars held by Britain be converted into gold.
A Weakening Dollar – The System under Strain
Early 1971 saw a noticeably growing US balance of payments deficit, with governments and central in major economies accumulating ever larger quantities of US dollars in volumes far exceeding the US Government’s (US Treasury’s) stock of gold. The US trade balance also moved into deficit.
In April 1971, major currencies began to appreciate against the US dollar in the forward markets, and currency volatility increased as central banks outside the US (chiefly in Europe) tried to stabilize their currencies against the US dollar by taking in large amounts of dollars and selling their domestic currencies (after expanding their own money supplies), which at the same time added to inflationary pressures in their economies.
This volatility caused Eurodollar interest rates to rise, which attracted further speculative dollar inflows into European countries led by West Germany, and triggered wider European currency trading bands as these currencies strengthened against the US dollar. On 10 May 1971 the Bundesbank was forced to float the Deutschemark, and the US dollar began falling in value against the West German currency.
This in turn led to the belief that the US dollar would be formally devalued, which in turn caused further speculative inflows into other currencies and out of the US dollar, and led to central banks in Europe holding huge amounts of unwanted US dollars.
On Friday 6 August 1971, Henry Reuss, Chairman of the Joint Economic Committee on Exchange and Payments, said that the US dollar was overvalued and the next day his Committee released a report reiterating this statement. This in turn caused further turmoil on the financial markets when they reopened on Monday 9 August 1971.
Panic about a Gold ‘Drain’
Given the limited amount of gold that the US Treasury held, or claimed to hold, versus the far larger amount of US dollars in the hands of ‘foreign’ central banks all over the world, this naturally caused panic in the US government and the US Treasury that the remaining US gold stockpile would be ‘drained’ by foreign central banks converting their huge US dollar balances into gold at the US Treasury gold window.
This 2 August 1971 discussion is fascinatingly explained in a 2009 University of Delaware thesis submission paper by Scott W. Ohlmacher titled “The Dissolution of the Bretton Woods System, Evidence from the Nixon Tapes, August – December 1971”
Ohlmacher writes:
“Connally continues to stress just how important it is to stop the gold drain.”
Connally [direct quote]: ‘In the international field the problem is one – the convertibility of dollars into gold and we’re going to have to stop that at some point…Everybody, I say ‘everybody’, most people tend to think that ten billion dollars [in gold reserves] is the point below which we should not go.’
Much later in the conversation, Nixon and Connally are joined by Haldeman. Connally and Haldeman detail just how serious the gold drain has become. Haldeman notes that the United States has lost $850 million in gold reserves in the week of August 2, 1971 alone.”
Connally continues that the French have called in over $1 billion in reserves in the past few weeks and that the Germans and the Dutch are looking to call in some $200-250 million more. Connally thinks that the President could hold on a decision until mid-September, but not later.”
[Source: Tape – August 2, 1971 (Conversation Number 553-6) Nixon with Connally and Shultz. White House Chief of Staff H.R. “Bob” Haldeman enters later. “The Dissolution of the Bretton Woods System, Evidence from the Nixon Tapes, August – December 1971” By Scott W. Ohlmacher, 2009. Thesis submission, University of Delaware]
France Spooks the Yanks
The list of countries demanding US gold during July 1971 included Switzerland, which bought $50 million in US Treasury gold, and France, which converted $191 million into gold. These gold transactions are confirmed by a 21 July 1971 US Federal Reserve Board of Governors report which states that:
“In official transactions this month…the U.S. Treasury sold $50 million equivalent of gold to Switzerland.”
“In August the U.K. and France will be repaying $638 million and $600 million equivalent, respectively, to the IMF. France has already notified the U.S. Treasury of its intention to purchase the $191 million in gold required for its [IMF] Fund repayment.”
(Source – Fed Greenbook 21 July 1971)
This $191 million gold sale to France did definitely go through in early August as the August 1971 Fed Greenbook states that:
“Late in the afternoon of Friday, August 6, the U.S. announced its Fund drawing of $862 million equivalent in Belgian francs and Dutch guilders plus the sale of $191 million in gold to France.”
Source – Fed Greenbook 18 August 1971)
A sum of US $191 million at $35 per troy ounce would mean France purchased 5.457 million ozs of gold (169.74 tonnes). This could have been the same gold which the French are said to have then transported back to France by military ship from the east coast of the United States (see below). As the Banque de France is an IMF gold depository, it would still be logical to bring the gold back to Paris since the gold purchase was intended to pay back the IMF and could be transferred into the IMF gold holdings at the Banque de France.
In addition to this $191 million gold purchase by France, it appears that in early August 1971, the French wanted to buy even more US Treasury gold and maybe did so. The French had also, according to US Treasury Secretary Connally (see above) “called in over $1 billion in reserves in the past few weeks.“
But beyond this, the British request for US Treasury gold was the main event of August 1971. There is ample evidence in everything from archives to academic papers to the memoirs of the US Government officials involved, that it was French but crucially British requests to exchange US dollars for gold in the week prior to 15 August that forced the US government to close the gold window and suspend US dollar convertibility into physical gold.
Hello Chaps, We’d like $3 Billion in Gold
In a 2016 article by Chris Barber titled “The Burden of Bretton Woods” published by the Nixon Foundation, Barber writes that:
“In the second week of August 1971, the British ambassador appeared before the United States Treasury and asked that $3 billion be converted into gold to act as “cover” for all their dollar assets.
It was then, in the midst of impending economic calamity, that Nixon had to confront the major crisis.”
In 2017, a NBER working paper by Michael D. Bordo, tells us that:
“The decision to suspend gold convertibility by President Richard Nixon on August 15 1971 was triggered by French and British intentions in early August to convert dollars into gold.”
[Source: “The Operation and Demise of the Bretton Woods System; 1958 to 1971” Michael D. Bordo, Working Paper 23189, National Bureau Of Economic Research (NBER)]
In 2011, the well-known Yanis Varoufakis (who would go on to be Greek Minister of Finance in 2015) in an article about currency unions and recycling dollar surpluses tells us that:
“In August of 1971 the French government decided to make a very public statement of its annoyance at the United States’ policies: President George Pompidou ordered a destroyer to sail to New Jersey to redeem US dollars for gold held at Fort Knox, as was his right under Bretton Woods!
A few days later, the British government of Edward Heath issued a similar request, though without employing the Royal Navy, demanding gold equivalent to $3 billion held by the Bank of England. Poor, luckless Pompidou and Heath: They had rushed in where angels fear to tread!”
A 2016 paper by Michael J Graetz of Columbia Law School, titled “A ‘Barbarous Relic’: The French, Gold, and the Demise of Bretton Woods”, also covers the French and British maneuvers saying that:
“In August 1971, French president Pompidou sent a battleship to New York harbor to remove France’s gold from the vault of the New York Federal Reserve Bank and to transport it to the Banque de France in Paris. Soon thereafter, gold accounted for 92 percent of French reserves.
On August 11, the British requested that the Treasury remove the $3 billion of gold from the U.S. depository of Fort Knox to the New York Federal Reserve vault, where the gold of foreign governments was stored.”
The British request to the US Treasury is reiterated in the monetary history book titled “The Commanding Heights: The Battle for the World Economy” by Daniel Yergin and Joseph Stanislaw (1997) in which they write:
“In the second week of August 1971, the British ambassador turned up at the Treasury Department to request that $3 billion be converted into gold.”
Further evidence comes from a 1993 book by Paul Volcker and Toyoo Gyohten titled “Changing Fortunes: The World’s Money and the Threat to American Leadership”. Paul Volcker was at that time in 1971 the US Treasury Undersecretary for Monetary Affairs, and states that:
“On Thursday, August 12, the Bank of England requests unspecified devaluation cover for its dollar reserves of about $ 3 billion. The Federal Reserve draws $2.2 billion on its swap lines, including $750 million for the Bank of England.”
Volcker, who was at the heart of the matter, then makes clear that this unspecified devaluation cover that the British requested was in the form of gold:
“If the British, who had founded the system with us, and who had fought so hard to defend their own currency, were going to take gold for their dollars, it was clear the game was indeed over.”
This massive sum of $3 billion in gold would have been equivalent to 2,666 tonnes of gold, and the US Treasury at that time claimed to hold less than 10,000 tonnes of gold. That would be over 25% of all claimed US Treasury gold.
While the Americans did not want to agree to one foreign central bank request for US dollar conversion into gold for fear of setting off a stampede of other central bank gold requests, it’s also possible that the US Treasury did not have all the gold at claimed to have in Fort Knox or at the New York Fed vault in Manhattan (at least not in Good Delivery gold bars), and that the Americans balked at a demand for 2,666 tonnes simply because they did not have enough gold to sell.
The Bank of England knew back in March 1968 when the London Gold Pool collapsed that the Americans had run out of Good Delivery gold, as is clear from a Bank of England memo from 14 March 1968 which said:
“It has emerged in conversations with the Federal Reserve Bank that the majority of the gold held at Fort Knox is in the form of coin bars, and that in certain cases these bars have a gold content of less than 350 fine ounces. If the drain on U.S. stocks continues it is inevitable that the Federal Reserve Bank will be forced to deliver what bars they have.”
“It would appear that the circumstances might well be such that very few bars of the current acceptable fineness could be found“
[Bank of England file C43/323/49]
[See BullionStar article “The Keys to the Gold Vaults at the New York Fed – Part 3: ‘Coin Bars’, ‘Melts’ and the Bundesbank” for details of this March 1968 Bank of England memo.]
So the Bank of England, more than any central bank in the world, would know the real truth about US Treasury gold holdings, as the scramble for US Treasury gold accelerated in August 1971.
The Earl of Cromer – Blue Blooded Baring
This is where the British ambassador to the USA at that time, George Rowland Stanley Baring, a.k.a. The 3rd Earl of Cromer, enters the picture. Baring, known as Rowland Baring, was not your ordinary diplomat, as he was also one of the highest level bankers of his time, and hailed from the famous Baring bankers family.
In fact, Rowland Baring ran Baring Brothers bank between 1949 and 1959. Other strings in Rowland Baring’s bow included being Governor of the Bank of England between 1961 and 1966, being a previous economic minister of the British embassy in Washington, being previous head of the United Kingdom Treasury and Supply Delegation, being an Executive Director of the World Bank in Washington, and being a Lieutenant-Colonel in the British Army (like my grandfather).
The Earl of Cromer was thus very familiar with both the Bank of England and the HM Treasury (British Treasury), as well as the way politics and economics worked in Washington DC. Baring had additionally also previously worked at JP Morgan & Company, Morgan Stanley & Company, and Kidder, Peabody & Company so was totally immersed in and connected to the New York – London axis of the ‘old wealth’ banking elite. In fact, he was the ‘old wealth’ banking elite.
So when The Earl of Cromer (who lived in the British Embassy in Washington DC between 1971 and 1974) strolls into the US Treasury offices in DC and says “Hello chaps, we’d like US$ 3 billion in gold on behalf of Her Majesty”, the yanks are going to sit up and take notice.
And that is exactly what happened. On 12 August 1971, The Earl of Cromer (Rowland Baring) turned up in the US Treasury in Washington DC on behalf of the Brits (HM Treasury and Bank of England), requesting that the US Treasury convert US $3 billion held by Britain into gold. This figure was then seemingly negotiated down to US$ 750 million, because the Americans were shell shocked.
In his 1976 book, “The Arena of International Finance”, Charles Coombs refers to the Cromer visit on page 217-218, quoting Treasury Secretary John Connally (page 218). Connally said:
“What’s our immediate problem? We are meeting here today because we are in trouble overseas. The British came in today to ask us to cover $3 billion, all their dollar reserves. Anyone can topple us – anytime they want – we have left ourselves completely exposed.”
Why was it a problem? Why could anyone topple the monetary system of the United States at any time? Perhaps it was because the Americans did not have as much gold as they claimed to have.
Coombs then comments that:
“Connally’s citation of the eleventh-hour British request for $3 billion of exchange cover as an example of imminent foreign attacks on the dollar is a travesty on the facts.
The Bank of England request for cover, quickly agreed in the amount of $750 million rather than $3 billion, was a direct consequence of justifiable British suspicion that the Treasury was on the verge of closing the gold window.“
Charles Coombs isn’t just any author as he had a 30-year career at the New York Fed, where he rose to be Head of Foreign Exchange Operations of the New York Fed, and he also for 16 years, was manager of the Open Market Committee for the overall Federal Reserve System.
What’s $3 Billion or $750 Million between friends
Coombs’ comment implies that what started as a request for US$ 3 billion by the Earl of Cromer was ‘quickly agreed’ at $750 million, which at $35 per troy oz would be 666.5 tonnes of gold. Still a huge amount of gold.
There is substance to the Coombs version of events, since there is a HM Treasury file in the National Archives in Kew, London (which I have visited and have read) titled “Report that 15 Aug measures had been forced on US administration by Bank of England’s demand for conversion of $750 million into gold: Prime Minister sought further information“. (File ref PREM 15/838 can be seen on the National Archives catalogue website here).
This file confirms that British ambassador, Rowland Baring (The Earl of Cromer) turned up at the US Treasury offices in Washington DC, and refers to the US$ 750 million request to be converted into gold.
“Great Britain planned to submit a massive request to convert US $3 billion into gold [footnote 93].
The request was received by Charles Coombs of the Federal Bank of New York on August 13, while visiting the Treasury Department in Washington [footnote 94].
The British request caused panic in the [US] Treasury and prompted Connally’s early return to Washington. The request indicated that the British government presciently understood that the time for remaining gold conversions was short. The United States was forced to act.
Should the British request be granted, the publicity of such a large transfer of gold would cause a European run on the Federal Reserve at the worst possible moment. …With less than 10 billion in gold reserves, before the British request, an American default loomed.”
Footnote 93 of Nicther’s book states that there are multiple memoirs of the people involved which mention the British request, including the memoirs of Connally, Haldeman, Stein, and William Safire.
The UK National Archives PREM 15/838 file also contains a letter from 13 August 1971 from the British Treasury (HMT) to the British Prime Minister’s office (Edward Heath’s office), denying that the gold conversion request had ever been made, saying that:
“at no time did the Bank of England ask for conversion of US dollars into gold/ nor is there any basis for a figure of $3 billion.”
[This 13 August 1971 letter is from Alan Bailer, Office of the Chancellor of the Exchequer (HM Treasury) to Robert Armstrong, 10 Downing Street (Prime Minster’s Office)]
As you can see from the carefully crafted wording of Bailey’s letter, this denial by HM Treasury did not say that HM Treasury didn’t ask for conversion of US$ 3 billion into gold on behalf of Britain’s Exchange Stabilisation Fund (EEA), nor that the British Government didn’t ask for conversion of US$ 3 billion into gold, merely that the Bank of England did not request conversion of US$ 3 billion. On a technical point, the Bank of England does not own any of Britain’s gold, it merely stores it. It’s the Exchange Stabilisation Fund, administered by HM Treasury, which owns British reserve assets, including US dollars and gold.
Also, given the fact that the dollars for gold request did take place (since there is a huge amount of evidence above to prove it), this HM Treasury denial can be taken as par for the course for weasel words governments, which, as we all know, lie all the time, even inter-departmentally to each other.
Bank of England Memos – Top Secret
If we turn to the Bank of England archives, there is also ample evidence in Bank of England file OV53/60 – International Monetary Reform 1971 that the Bank of England was for weeks before 15 August 1971 actively discussing the issue of the Americans closing the gold window and preparing for that outcome.
First up is a Bank of England internal paper from 19 July 1971, marked ‘Secret’, and titled “Some Possible Consequences of the Americans Formally Going Off Gold‘. This paper, which was written by Bank of England expert John Sangster (JLS) and circulated among senior executives of the Bank, discussed the scenario of the US closing the gold window and the alternatives the British had to chose from if that outcome occurred. See screenshot below.

“11. The more immediate question is how do we protect the $4.1 bn of reserves held in US dollars. Admittedly we have long term debts in US dollars of $5.5 bn but substantial losses on our short-term assets would weaken our intervention ability…:
“Obviously asking the Americans for gold or SDRs would only precipitate the action we are seeking to avoid“.
“Demand a Massive Amount of Gold from the Americans”
On Tuesday 10 August 1971, the Bank of England circulated another internal Top Secret memo, with a similar title “The Possibility of the US Going Off Gold“. This time the Bank listed the options available to protect the British reserves from the eroding value of the US dollar, including the first option ‘Demand a massive amount of gold from the Americans’ They actually used these exact words:
“The Reus Sub-Committee Report published last Friday has brought the US dollar under heavy pressure. The possibility of the Americans formally going off gold has been advanced. It may even be imminent.
We need urgently to consider whether action should be taken to protect the reserves. The EEA [Exchange Equalisation account] holds US $3.5 bn, either in New York ($2.75 bn) or in the Euro-market via the BIS ($0.75 bn).
Against these short term assets are long term liabilities of $4.5 bn in respect of the US end-year loans, Exim and ECA/MSA loans (another $1 bn is outstanding for the Canadian loan).
There are four main protective steps available –
(i) Demand a massive amount of gold from the Americans – but this in itself would probably be sufficient to force the Americans off gold.”
The memo then listed options (ii) pay IMF obligations so as to reduce dollar balances, (iii) ask the US to draw $ 2 billion on the inter-central bank swap lines, and (iv) put any remaining funds into Rossa bonds denominated in sterling.
The memo said that option “(i) can be disregarded. The Americans would probably refuse and close the gold window“.
Option (ii) could not be done quickly, said the memo. That left options (iii) and (iv) which would protect sterling in the event of a dollar devaluation.
Covering their Assets
And what did the old chaps in the Bank of England mean by ‘covering their US dollar assets‘? Why of course, it meant asking the Americans to convert Britain’s dollar balances into gold bars.
Which is preciously why the Earl of Cromer, Rowland Baring, strolled into the US Treasury offices 2 days later and asked that US$ 3 billion of Britain’s US dollar holdings be converted into gold bars.
Recall the use of the word COVER in various quotes above:
Barber (2016) – “In the second week of August 1971, the British ambassador appeared before the United States Treasury and asked that $3 billion be converted into gold to act as “COVER” for all their dollar assets.”
Volcker and Gyohten (1993) – “On Thursday, August 12, the Bank of England requests unspecified devaluation COVER for its dollar reserves of about $ 3 billion. The Federal Reserve draws $2.2 billion on its swap lines, including $750 million for the Bank of England.
..If the British… were going to take gold for their dollars, it was clear the game was indeed over.”
Coombs (1976) – quoting Connally “The British came in today to ask us to COVER $3 billion, all their dollar reserves
Coombs again – “The Bank of England request for COVER, quickly agreed in the amount of $750 million rather than $3 billion, was a direct consequence of justifiable British suspicion that the Treasury was on the verge of closing the gold window.“
And that is how the British bankers via the Earl of Cromer triggered the US to close the gold window at that precise time on 15 August 1971, knowing that “The Americans would probably refuse and close the gold window“.
Which is what the Americans then did. This gold window closure then ushered in the US dollar fiat era, a 50 year period of a fake and eroding world reserve asset, the fallout of which we see right up to this day, and which has been responsible for totally altering the world’s monetary and economic landscape, and not in a good way. (See the fantastic visual charts website https://wtfhappenedin1971.com for details of why this is so.)
An important question arising from Cromer’s request to the US Treasury is who was working for who, and who benefited from the gold window closure.
Was it the outcome of a random set of events? Or was there a joint US-British decision to orchestrate the end of gold convertibility under the guise of a monetary crisis? Were there shadowy and powerful private banking interests influencing events behind the scenes? And did the US close the gold window because they had far less gold than they claimed to have?
A 19 March 1973 US State Department cable, marked secret, refers to a 16 March 1973 meeting in Bonn between then US Secretary of the Treasury George Shultz and then West German Chancellor Willy Brandt, in which Shultz says that:
“huge deficits in the US balance of payments had occurred and had drained our gold reserves.
The week before August 15, 1971, a rush on those reserves forced the closing of our gold window bringing the end of convertibility.”
Very Interestingly, the word ‘drained’ is specifically used. ‘Drained’ is defined as ‘to deplete gradually, especially to the point of exhaustion‘, or ‘to become empty by the drawing off of‘. So, did the US Treasury even have half the gold it claimed to have in August 1971 or was Fort Knox already empty, and was this another reason for the sudden gold window closure?
These, however, are questions for another day.
One final point to note is that while the temporary suspension of the US Treasury gold window has been on-going for 50 years now and is a source of ridicule for the US Government due to the wording ‘temporary’, the last laugh is on the foreign central banks, since under international law, all of their billions of US dollar holdings prior to the 15 August 1971 gold window closure are still valid and legal claims against US Treasury gold holdings. Think about that for a moment.
Last Word to Arthur Burns
For now, the last word goes to Arthur Burns. the then chairman of the Board of Governors of the Federal Reserve System during August 1971, who wrote in his Green Notebook journal on 12 August 1971 that:
“My efforts to prevent closing of the gold window – working through Connally, Volcker, and Schultz – do not seem to have succeeded.
The gold window may have to be closed tomorrow [13 August] because we now have a government that seems incapable, not only of constructive leadership, but of any action at all. What a tragedy for mankind!”
Big losses ahead for markets? Jeremy Grantham’s terrifying new forecasts
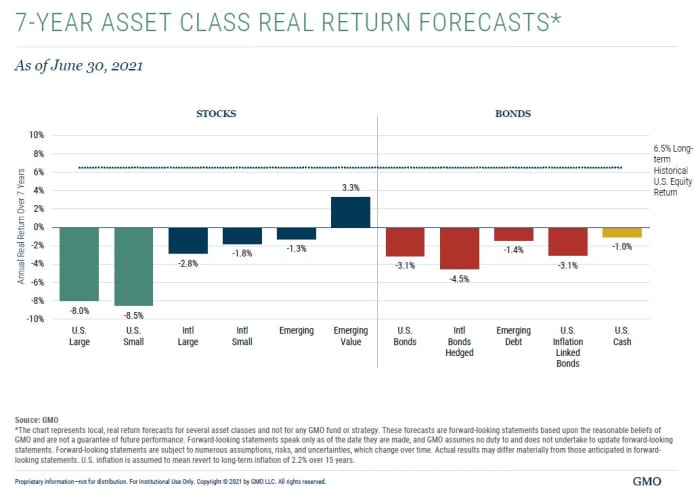
If you have a 401(k) and you’re of a nervous disposition, you probably don’t want to look at the chart above.
Even by the standards of GMO, the super-cautious money management firm in Boston best known for its famous co-founder Jeremy Grantham, it’s terrifying.
It shows about the worst medium-term forecasts on record for pretty much all the assets most of us own in our retirement accounts. Large company U.S. stocks like the S&P 500 SPY, +1.03% ? Small company U.S. stocks like the Russell 2000 RUT, +0.46% ? International stocks? U.S. bonds, foreign bonds, inflation-protected bonds? GMO thinks if you buy them now and hold them over the next seven or so years, they will all – all—lose you money in real, purchasing-power terms.
In the case of some of these mainstream investments, the predicted losses are huge. Those 8% and 8.5% annual losses on U.S. large-caps and small-caps? If they happen, they’ll mean your SPDR S&P 500 ETF SPY, +1.03% and Vanguard S&P 500 Trust VOO, +1.00% and Schwab U.S. Small-Cap ETF SCHA, +0.56% lose about half their value, in inflation-adjusted terms, by 2028.
I’ve been following GMO’s forecasts for nearly 20 years. I’ve never seen one this bad, and I’ve seen some that were really bad—like the ones they made in 2000 and 2007, just before the two big crashes.
There is a tendency at certain moments for market followers to roll their eyes whenever anyone mentions the latest gloomy predictions from GMO. “Those guys have been wrong for years,” say skeptics. They point out, for example, that GMO 10 years ago predicted emerging markets would probably do really well and U.S. stocks badly. Instead, the reverse happened.
Go to an online chat room like Bogleheads and you can find plenty of skeptics.
But it’s not quite that simple. GMO was among the few firms to predict the 2000-2003 and 2007-2009 crashes. And each time, people laughed. The online chat rooms were different — 20 years ago it was Yahoo and Raging Bull—but the sound was the same.
In the event, the warnings GMO made in the late 1990s were remarkably accurate. It ranked 10 major asset classes by future investment performance, and got them pretty much in line. “The chances of getting that forecast exactly right were less than one in 500,000,” The Economist magazine calculated.
The worst among the 10? The S&P 500.
Money printing is a flawed experiment that’s done America more harm than good
Investors are captive to Modern Monetary Theory and its non-answers to economic problems
Investors are captive to Modern Monetary Theory (MMT) and its convenient non-answers to the vexed issues of economic stagnation, unsustainable public finances and debt. People’s savings are underwritten by high asset prices, courtesy of this novel brand of economics.
A state, MMT argues, does not finance its spending out of taxes or borrowing but by creating money. Nations cannot go bankrupt when it can print its currency. Therefore, a country with its own currency can run deficits and accumulate debt at almost whatever level deemed necessary.
Little about MMT is new. Keynesian deficit spending has been used since the 1930s. A country’s ability to print its own currency has been accepted since the end of the gold standard in the 1970s. Central-bank financed government spending via quantitative easing has been used extensively by Japan since 1990 and globally since 2008.
MMT advocates that in the face of inadequate demand, governments spend to move the economy to full employment. This is the job guarantee which requires everyone who is willing to work to have one. An alternative, unpopular among MMT advocates, is for government-funded universal basic income (UBI), providing every individual an unconditional flat-rate payment irrespective of circumstances.
MMT ignores several issues. First, it is unclear where useful, well-paid work will come from and how jobs will be created. Government influence over the productive sector that produces actual goods and services is limited. The impact of employment-reducing technology and competitive global supply chains is glossed over. It is unclear whether the deficit spending needs to be productive or how it will achieve an acceptable financial or social rate of return.
Second, critics point to the risk of inflation. Large deficits financed by money creation exceeding economic production changes can lead to hyperinflation. MMT acknowledges the risk but only where the economy is at full employment or there is no excess capacity. Government, MMT-ers argue, can raise taxes or reduce spending to control inflationary pressures.
Third, the idea only applies to states able to issue their own fiat currencies. It could not be applied to the European Union, where individual nations have ceded currency sovereignty to the European Central Bank. It is also unavailable to private businesses or households, unless the state underwrites private debt.
Fourth, the exchange rate may be a constraint. Where a country borrows in its own currency from foreigners or engages in cross-border trade, investors must have confidence in the government, monetary authorities and the stability of the exchange rate. As periodic U.S. dollar DXY, +0.09%weakness shows, excess deficits and money printing may cause financial markets to lose confidence and force a devaluation,. Businesses may not be able to import goods at affordable cost or service foreign currency denominated debt.
Fifth, there are operational challenges. In addition to creating the right jobs, it is necessary to set the natural rate of employment or the UBI level and structure. Measures used to set policy, such as unemployment, inflation rate, money supply statistics or output gaps, are complex to calculate.
Finally, the transition to MMT may create instability. An exchange-rate or inflation shock would affect existing investors and trade. Policymakers may be unable to control the process once set in motion. Where supply constraints are reached, excessive deficit-financed spending would result in inflation, higher rates and a currency correction. As with all policy, lags in the availability of data, which may be ambiguous, make management difficult. It is uncertain what would happen if MMT failed. The road back from any experiment is problematic and the difference between theory and practice is larger in reality than in concept.
STAY SAFE, DUMP THE DOLLAR
STOCK DOC
